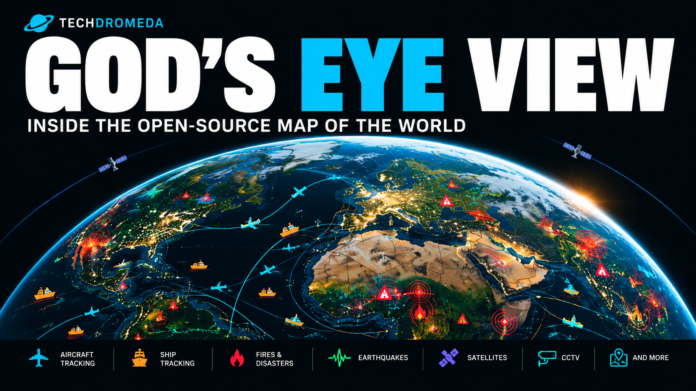
Imagine opening a map, zooming over an airport, and watching aircraft move across a photorealistic 3D city. Then you switch layers and see ships offshore, active fires detected by satellites, earthquakes, public traffic cameras, road congestion, infrastructure, and other public signals.
Now imagine asking an AI to fly you to another location, identify something on the map, or build a route between two places.
That is the idea behind God’s Eye View, an open-source browser application created by developer Bilawal Sidhu. Despite its spy-satellite aesthetic, it does not provide access to classified surveillance. Instead, it combines publicly available data sources inside an interactive 3D globe. The source code is released under the MIT License, although the third-party datasets and imagery it displays remain subject to their own licenses and terms.
Quick answer: God’s Eye View is an open-source geospatial visualization tool that puts aircraft, ships, satellites, earthquakes, fires, traffic, public cameras, and other public data layers on an interactive 3D globe. You can run it locally, add supported API keys for additional data, and use its AI voice interface to navigate and interact with the map. It looks like a surveillance system, but its underlying information comes from public and third-party sources rather than secret government feeds.
What exactly is God’s Eye View?
At first glance, God’s Eye View looks like something from a military command center.
The screen is dominated by a 3D representation of Earth. Aircraft appear as moving objects. Ships can be tracked across waterways. Different visual modes can make the interface resemble a night-vision display, thermal imagery, or a tactical map.
The important distinction is that the dramatic interface is largely presentation. The underlying system is a collection of public data feeds and geographic visualization tools.
The project describes itself as a real-time intelligence console for the planet. Its current repository combines a photorealistic 3D globe with layers covering aircraft, ships, satellites, earthquakes, traffic, public cameras, fires, infrastructure and more.
That makes the project interesting for a reason beyond its appearance.
It demonstrates how much information about the physical world is already available publicly — and what becomes possible when someone puts many of those sources into one interface.
Is the data in God’s Eye View actually real?
Yes, but “real” needs an important qualification.
The application can display genuine observations from public data sources, but that does not mean every object is being observed continuously or with perfect accuracy.
For example, aircraft tracking can be based on signals received by networks such as OpenSky and ADS-B sources. Ship information can come from AIS data. NASA’s FIRMS system provides satellite-derived active-fire detections, while earthquake information can come from geological monitoring systems.
The project itself warns that its data can be delayed, incomplete, modeled, inferred, or wrong. That distinction matters because a visualization can look extremely precise even when the underlying information has limitations.
In other words, God’s Eye View is better understood as a visualization of public information than as an authoritative global surveillance system.
Why does the 3D globe look so realistic?
The visual foundation comes from modern 3D geospatial technology.
God’s Eye View can use Google’s Photorealistic 3D Tiles, which provide detailed three-dimensional geographic data for compatible applications. Google describes the technology as a way to stream photorealistic 3D geodata into custom visualization experiences, while Cesium provides the 3D rendering technology commonly used to display this kind of geographic information.
This is what gives the application its striking appearance.
Instead of looking at a flat map covered with icons, you can tilt the camera, move through cities, zoom between global and local views, and watch tracked objects move through a three-dimensional environment.
But there is an important catch for anyone thinking about using the project commercially.
The software code is MIT-licensed, but that license does not automatically apply to Google’s mapping data, third-party datasets, imagery, models, or other external content. The project’s own licensing documentation explicitly separates its source code from those third-party resources.
How can you run God’s Eye View?
You do not necessarily need to be a programmer.
The project currently supports a Pinokio installation path, as well as a traditional local development setup. The repository says the application can start without API keys using its keyless map configuration, while additional providers can be connected later. It supports Windows, macOS and Linux through the documented installation routes.
For developers, the project uses a relatively conventional web stack. Its contribution documentation describes a setup based around JavaScript, CesiumJS and Vite, with individual data layers separated into their own modules.
That architecture is important because God’s Eye View is designed to be extended.
You are not limited to whatever the original interface happens to include. Developers can add new layers, data sources and features through the project’s open-source codebase.
What can you actually see on the map?
The most impressive part of God’s Eye View is not one particular feature. It is the ability to stack different types of information on the same geographic view.
Turn on aircraft and the globe becomes an air-traffic visualization.
Switch to ships and the coastlines become a moving network of vessels.
Add earthquakes or active fires and the same map starts functioning as an environmental monitoring interface.
The repository currently documents sources including OpenSky and ADS-B data for aircraft, AISStream for ships, NASA FIRMS for active fires, CelesTrak for satellite information, USGS earthquake data, public city cameras, OpenStreetMap-based infrastructure and optional traffic data.
That combination is what makes the application feel much more powerful than a conventional map.
Why can ship coverage look surprisingly empty?
One of the easiest mistakes to make with a visualization like this is assuming that an empty map means nothing is happening.
It often means the data coverage is incomplete.
Ship tracking illustrates the problem particularly well. Automatic Identification System, or AIS, signals can provide information about vessels, but the availability of those signals depends on where receivers and data providers have coverage.
Land-based receivers are especially useful around coastlines and busy shipping areas. Coverage can therefore look dense in one region and much thinner somewhere else.
Satellite-based observation can expand coverage, but it introduces additional costs and technical limitations.
The result is a map that can be visually convincing while still being an imperfect representation of reality.
That is why God’s Eye View should not be treated as a replacement for professional maritime or aviation systems.
What can the AI voice mode do?
The application goes beyond traditional map controls by adding an AI-driven voice interface.
The project’s documentation describes OpenAI Realtime as the engine behind its voice experience. Users can issue commands to navigate the globe, activate layers, manipulate scenes and ask questions about visible locations.
This changes the interaction model.
Instead of searching manually for a location, you can tell the system where you want to go. Instead of hunting through menus to activate a layer, you can ask it to enable one.
The AI can also provide contextual information about places and objects.
That does not mean the AI magically knows everything happening on Earth. It is still working with the application’s geographic context and the information available to its underlying model and data sources.
But combining natural-language commands with a live geographic interface makes the system feel considerably more conversational than a normal mapping application.
What about traffic and CCTV cameras?
God’s Eye View can also combine road information, congestion visualization and publicly accessible camera feeds.
Traffic data deserves the same warning as aircraft and ship tracking: a visualization does not necessarily represent individual vehicles in real time.
The project’s documentation says its traffic layer can use aggregate location data to visualize traffic flow, while public cameras provide another view of activity in certain cities.
This distinction is important for privacy.
A traffic-density layer can tell you that a road is heavily congested without telling you where one particular vehicle is going. Similarly, a public CCTV image may provide a snapshot of a location without creating a continuous, high-frame-rate surveillance feed.
The project therefore turns publicly accessible information into something easier to explore, rather than creating a private camera network from scratch.
Can God’s Eye View show wildfires and earthquakes?
Yes, and this is where the project becomes more than a flashy aircraft tracker.
NASA’s FIRMS system provides satellite-derived active-fire information from instruments including MODIS, VIIRS and Landsat. NASA describes its real-time products as becoming available within defined periods after satellite overpasses, with ultra-real-time data available even faster in some regions.
When that information is placed on a globe, individual fire detections become geographically understandable.
You can see clusters rather than isolated numbers on a webpage.
Earthquake data can be treated similarly. Instead of reading a list of seismic events, you can place them directly onto the geographic environment where they occurred.
This is one of the strongest ideas behind the project: different datasets become more useful when their geographic relationships are visible.
Can you use it to investigate real-world events?
Potentially, yes — but this is where responsible use becomes especially important.
The project is well suited to exploratory analysis, visualization and storytelling. For example, an investigator or journalist could combine publicly available geographic data with documented reports and media to build a map showing how an event unfolded.
A developer could also create a custom layer for a particular disaster, infrastructure network or environmental phenomenon.
But the existence of an impressive map does not automatically make its conclusions reliable.
Public-source intelligence, often called OSINT, can be incomplete. A missing data point does not prove that something did not happen. A tracked object can be mislabeled. A location can be outdated. And an AI-generated explanation can confidently misunderstand what it is looking at.
The project’s own contribution guidance makes this philosophy explicit: public-data inference should not be presented as authoritative intelligence, and contributors are discouraged from adding sources that violate their terms.
Why is the open-source part more important than the spy aesthetic?
The most interesting feature of God’s Eye View may actually be its code.
Because the project is open source, developers can inspect how the visualization works, add new layers, experiment with alternative data sources and contribute changes back to the repository.
The repository is licensed under MIT, although — again — that applies to the source code rather than automatically granting rights to every external dataset displayed by the application.
This distinction makes the project a useful example of a broader shift in software development.
A developer no longer needs to build an entire geographic information system from scratch. They can combine an existing globe renderer, public datasets, APIs and AI-assisted programming into a much larger application.
God’s Eye View is essentially a demonstration of what happens when those pieces are assembled into one interface.
Could you build your own version?
That is one of the project’s biggest promises.
The codebase is structured around independent data layers, making it possible for contributors to add functionality without rebuilding the entire application. The project’s documentation specifically encourages contributions and requires new data sources to be documented with their licensing and attribution requirements.
For an experienced developer, that means God’s Eye View can function as a starting point rather than a finished product.
You could imagine specialized versions focused on natural disasters, shipping, aviation, climate monitoring, urban infrastructure or even a particular city.
The important part is that the map itself is not the intelligence.
The data is the intelligence. The map is the interface that makes relationships visible.
What are the biggest limitations?
The biggest limitation is also the easiest thing to miss: the globe can look more certain than the data really is.
A glowing aircraft icon moving smoothly across a detailed 3D city creates an impression of precision. But the underlying signal may be delayed, estimated or incomplete.
The same applies to ships, traffic, cameras, satellite observations and AI-generated descriptions.
There are also licensing constraints. Google’s Photorealistic 3D Tiles have their own usage policies, including attribution requirements and restrictions around certain uses. Google’s current documentation specifically describes requirements for displaying attribution when using the tiles with CesiumJS and other renderers.
That matters if someone wants to turn a personal experiment into a commercial product.
Open source does not mean every component is free for every purpose.
So, is God’s Eye View really a “spy satellite” for everyone?
Not literally.
It does not give ordinary users access to a secret government satellite network. What it does is arguably more interesting: it demonstrates how much of the modern world can already be reconstructed from public digital signals.
Aircraft broadcast information.
Ships transmit identifying signals.
Satellites observe the planet.
Cities publish camera and transportation data.
Scientific organizations publish earthquake and fire information.
Companies operate enormous geographic infrastructure.
Developers then build interfaces that connect these fragments.
God’s Eye View packages many of those fragments into a single interactive globe.
That is why the project feels so futuristic even though much of the underlying information is not secret.
The real breakthrough is putting all the pieces together
A map showing aircraft is useful.
A map showing ships is useful.
A fire-monitoring dashboard is useful.
A traffic application is useful.
A satellite tracker is useful.
But combining them changes the experience.
Suddenly, a geographic location is not just a point on a map. It can become a collection of interconnected signals: aircraft overhead, ships offshore, nearby infrastructure, road congestion, public cameras, environmental events and other publicly available information.
That is the real idea behind God’s Eye View.
The project does not give you omniscience. It gives you a common visual window through which many different public datasets can be explored together.
And because the underlying code is open, that window can keep changing.
The most interesting question, then, is not what God’s Eye View can track today.
It is what developers will add to it tomorrow.

